According to the National Inventory Report of greenhouse gases submitted by Canada on 2023 to the United Nations (https://unfccc.int/documents/627833) Canada emitted a total of 670,000 kt CO2 eq on 2021. In order to give some scale to this, a car trip from Montreal to Toronto uses ~85kg. So this would be equivalent of going from Toronto to Montreal ~7.88×10^6 times, if we assume that each time we bring person from Montreal to the Roger’s Centre we would need ~159 Roger Centres to fit all the people.

To clarify the units, CO2 eq is a standardized unit defined by the Intergovernmental Panel on Climate Change (IPCC) as a way to compare all the greenhouse gases with respect to carbon dioxide using as the underlying radiative forcing.
“The amount of carbon dioxide (CO2) emission that would cause the same integrated radiative forcing or temperature change, over a given time horizon, as an emitted amount of a greenhouse gas (GHG) or a mixture of GHGs”
Taken from https://www.ipcc.ch/sr15/chapter/glossary/#:~:text=CO2%20equivalent%20(CO2,or%20a%20mixture%20of%20GHGs.
To put these numbers in perspective we can compare Canada’s report with other high emitting countries such as: United States, France, Germany and the UK. One think to keep in mind is that these reports are made directly by the country, but in general we can see that Canada was emitting less in comparison to other high emitters, but for example in terms of waste it is emitting more than Germany
| Country | Total Sum Emissions (CO2e) | Total Emissions (CO2) | Total Emissions (CH4) | Total Emissions (NO2) |
|---|---|---|---|---|
| CO2 equivalent (kt) | ||||
| France | 4.032720e+05 | 3.017997e+05 | 63387.063423 | 27160.408866 |
| United Kingdom | 4.306537e+05 | 3.425911e+05 | 57432.708896 | 19195.196333 |
| Canada | 6.531257e+05 | 5.190030e+05 | 91062.370000 | 30546.941902 |
| Germany | 7.643564e+05 | 6.750661e+05 | 52255.076778 | 25930.957622 |
| Russia | 1.650019e+06 | 1.158765e+06 | 343092.742150 | 106734.950143 |
| USA | 5.586003e+06 | 4.200174e+06 | 793415.207249 | 405122.495098 |
Post-Meter Methane Emissions
As explained in a previous post (https://montrealexplorer.com/climate-change-as-a-business-opportunity/) by reducing methane emissions we could be able to tackle climate change and reduce its effects. In particular there is a sector that wasn’t included in the report until recent years, which is post-meter, considered as the methane emissions that are beyond the better often arising from end-points at houses or commercial business.
The paper “An Estimate of Natural Gas Methane Emissions from California Homes” by Marc L. Fischer et al (2018), in which they measure the whole house emissions and appliance emissions of natural gas from 75 single-family California homes provides an estimate of how much could post-meter account in the NIR from the US.
After extrapolating the data using Bayesian Markov chain Monte Carlo sampling with the California housing statistics they end up saying that “[…] emissions from residential NG are 35.7 (21.7- 64.0) Gg CH4/yr, equivalent to 15% of California’s NG CH4 emissions” (Fischer, 2018). Assuming this is phenomena is common, we are talking about ~15% of the natural gas consumption of a city goes into leaks and this is not something that could benefit anyone as it is bad for the environment and a waste of money for the end-client as well as the distributors of natural gas.
What is the current panorama in Canada with respect to the report of post-meter methane emissions?
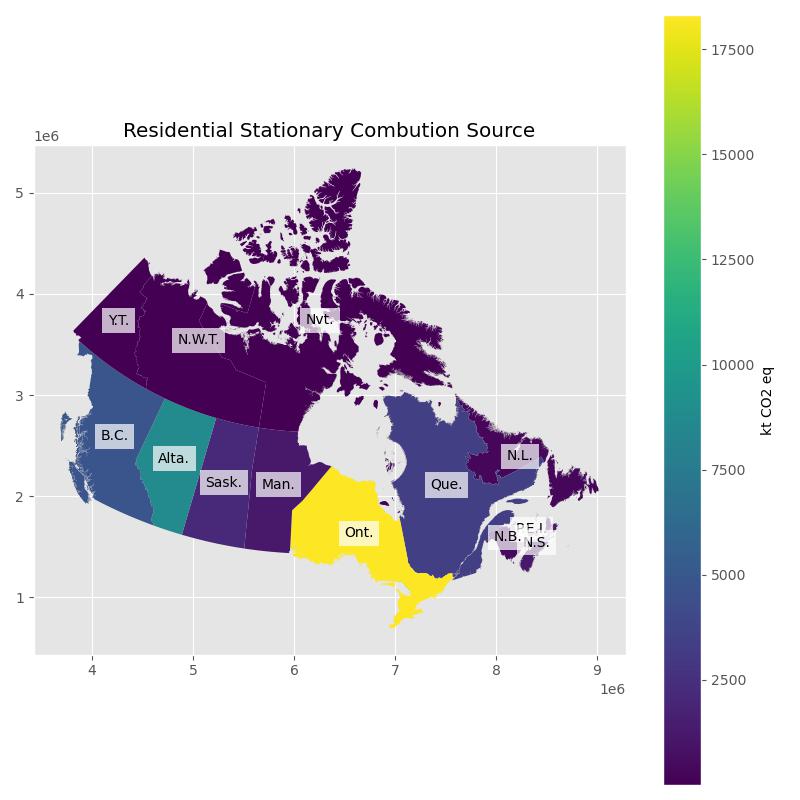
Even though Alberta is the province which overall uses more natural gas in Canada, in terms of overall emissions from the residential stationary combustion source point of view it is Ontario the one which pollutes the most in the aggregate of all the greenhouse gases. Where stationary combustion source includes ovens, boilers, furnaces and other

Summary
In conclusion, Canada’s 2023 National Inventory Report shows that the country emitted 670,000 kt CO2 eq in 2021. Compared to other high emitters like the United States, France, Germany, and the UK, Canada’s emissions are significant but not the highest. However, Canada emits more waste-related greenhouse gases than Germany. Recent inclusion of post-meter methane emissions, which are leaks from residential and commercial endpoints, highlights the importance of addressing these leaks to reduce overall emissions.
Ontario leads in residential stationary combustion emissions, even though Alberta uses more natural gas. This highlights the need for targeted emission reduction strategies across different regions and sectors in Canada.

Leave a Reply